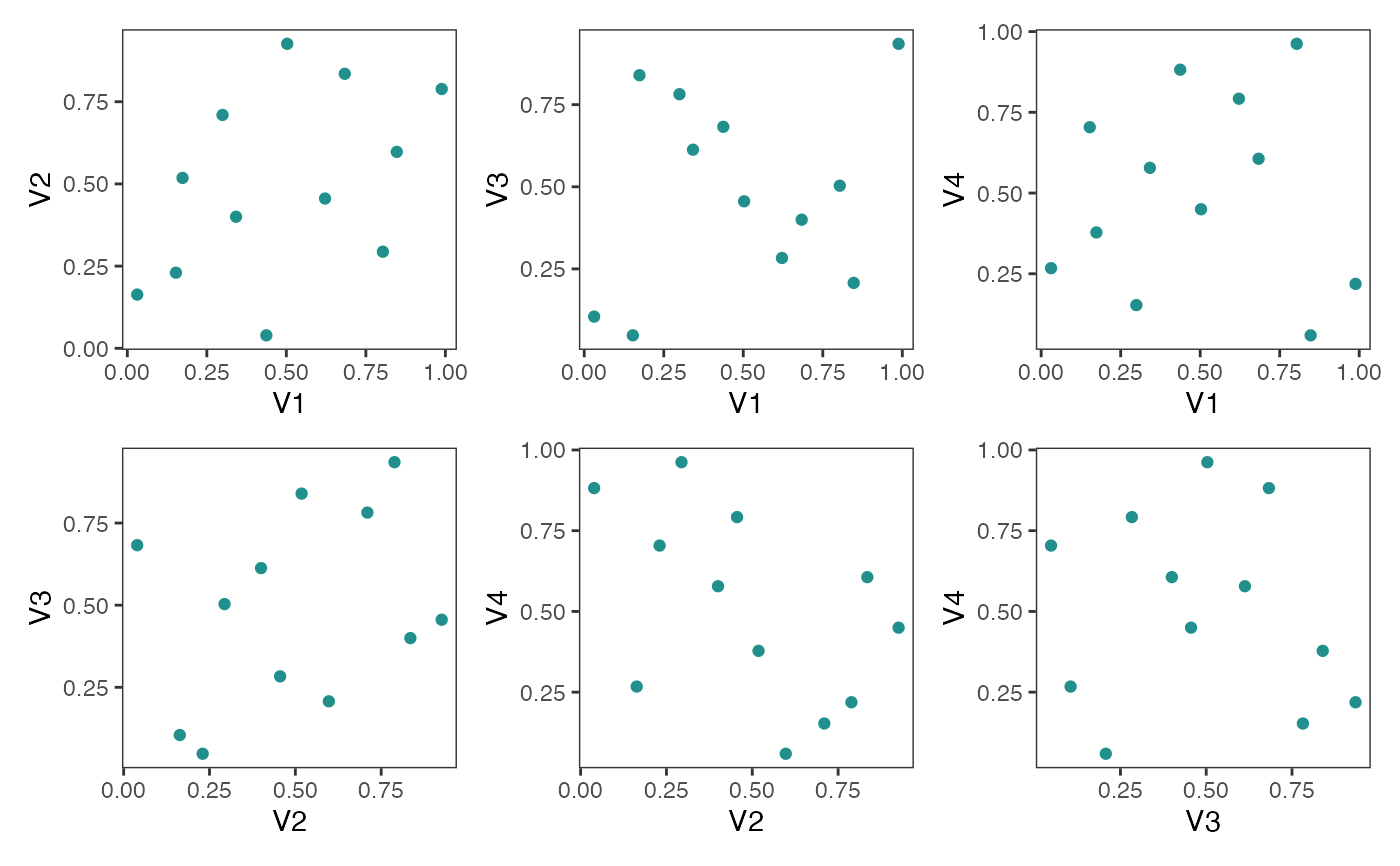
Two Dimensional Projections of Latin Hypercube Designs
Usage
pairs_plot(
  design,
  point_color = "#21908CFF",
  point_size = 1.5,
  grid = c(-1, -1),
  n_columns = 2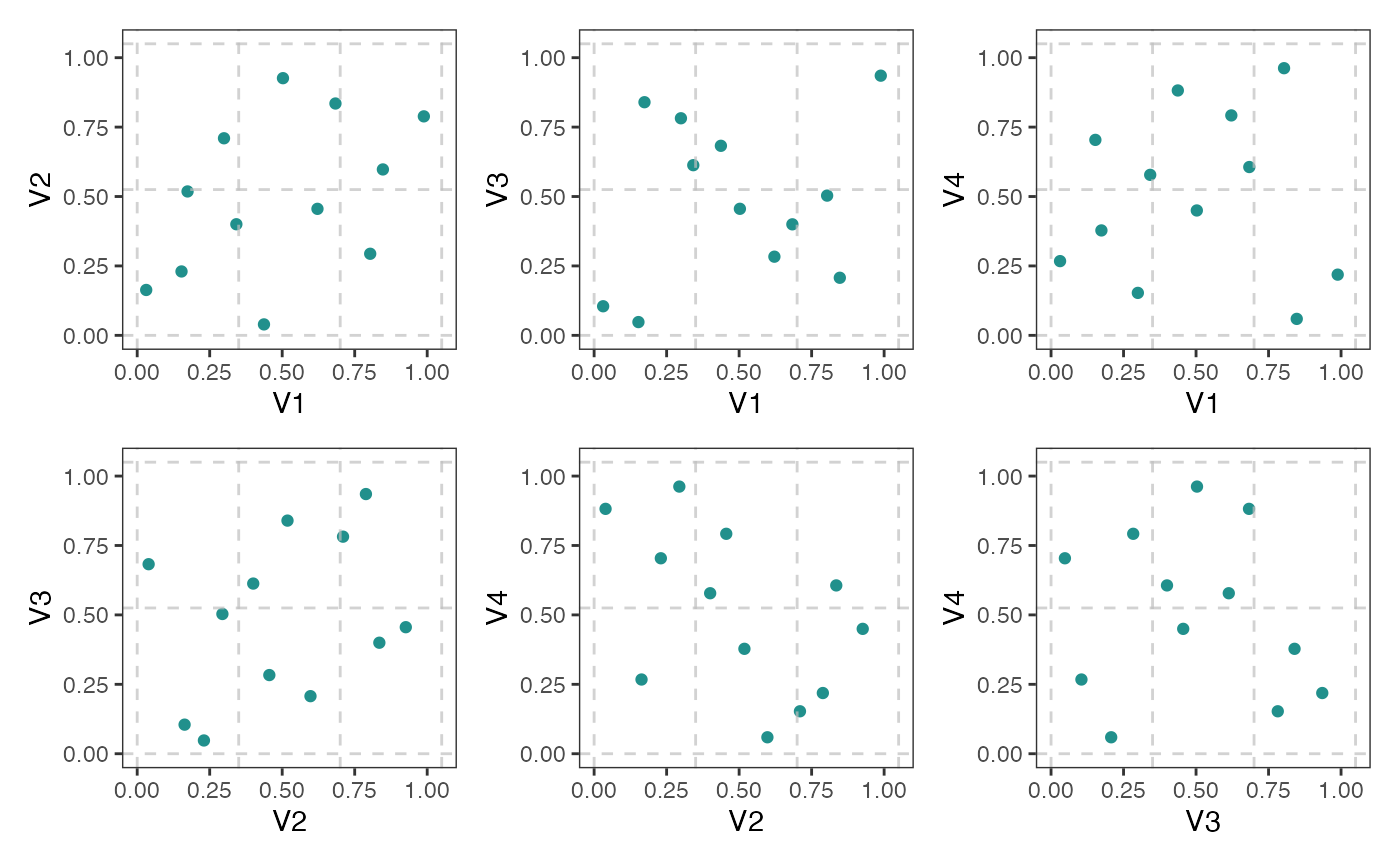
)Two Dimensional Projections of Latin Hypercube Designs
pairs_plot(
design,
point_color = "#21908CFF",
point_size = 1.5,
grid = c(-1, -1),
n_columns = 2
)