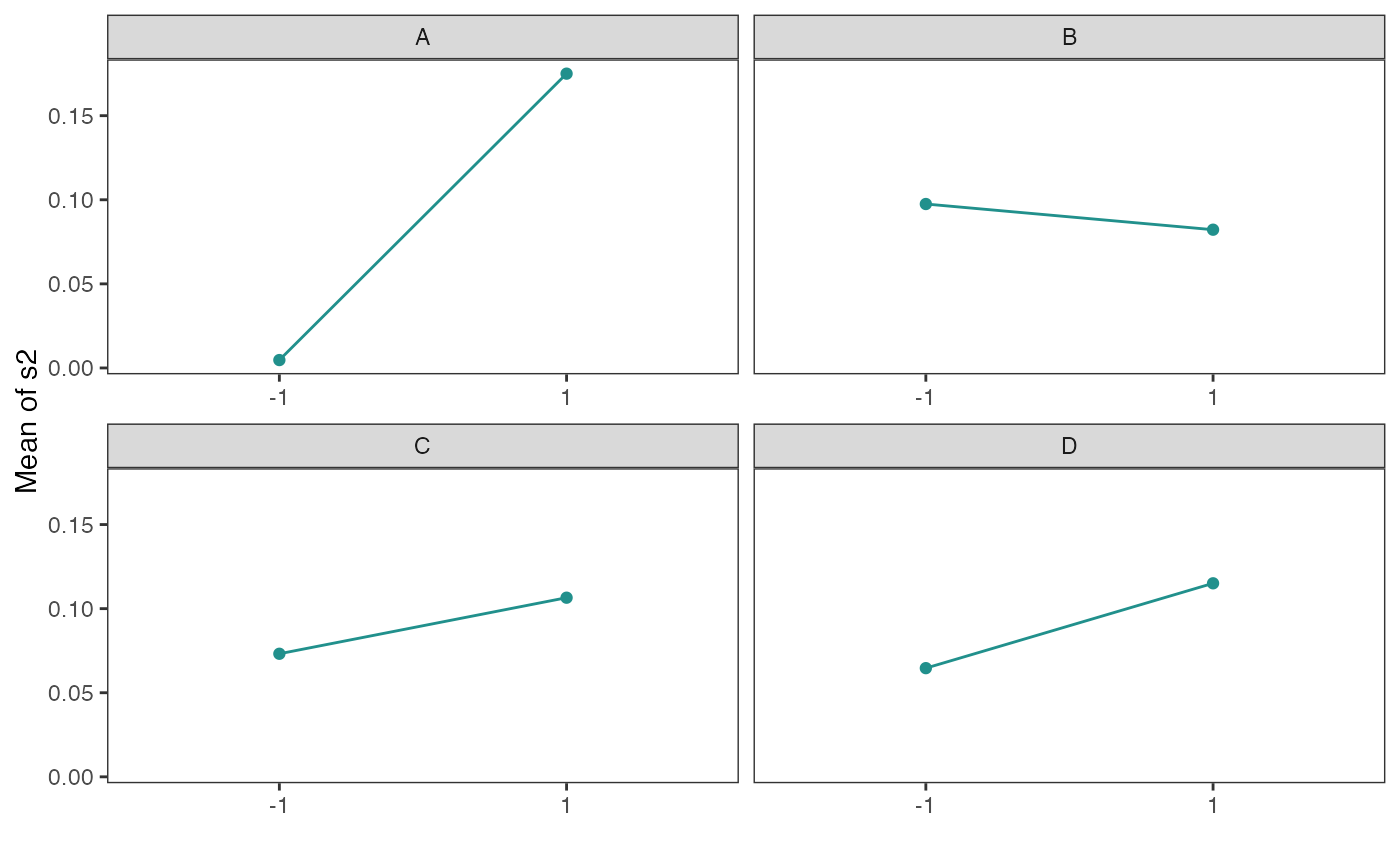
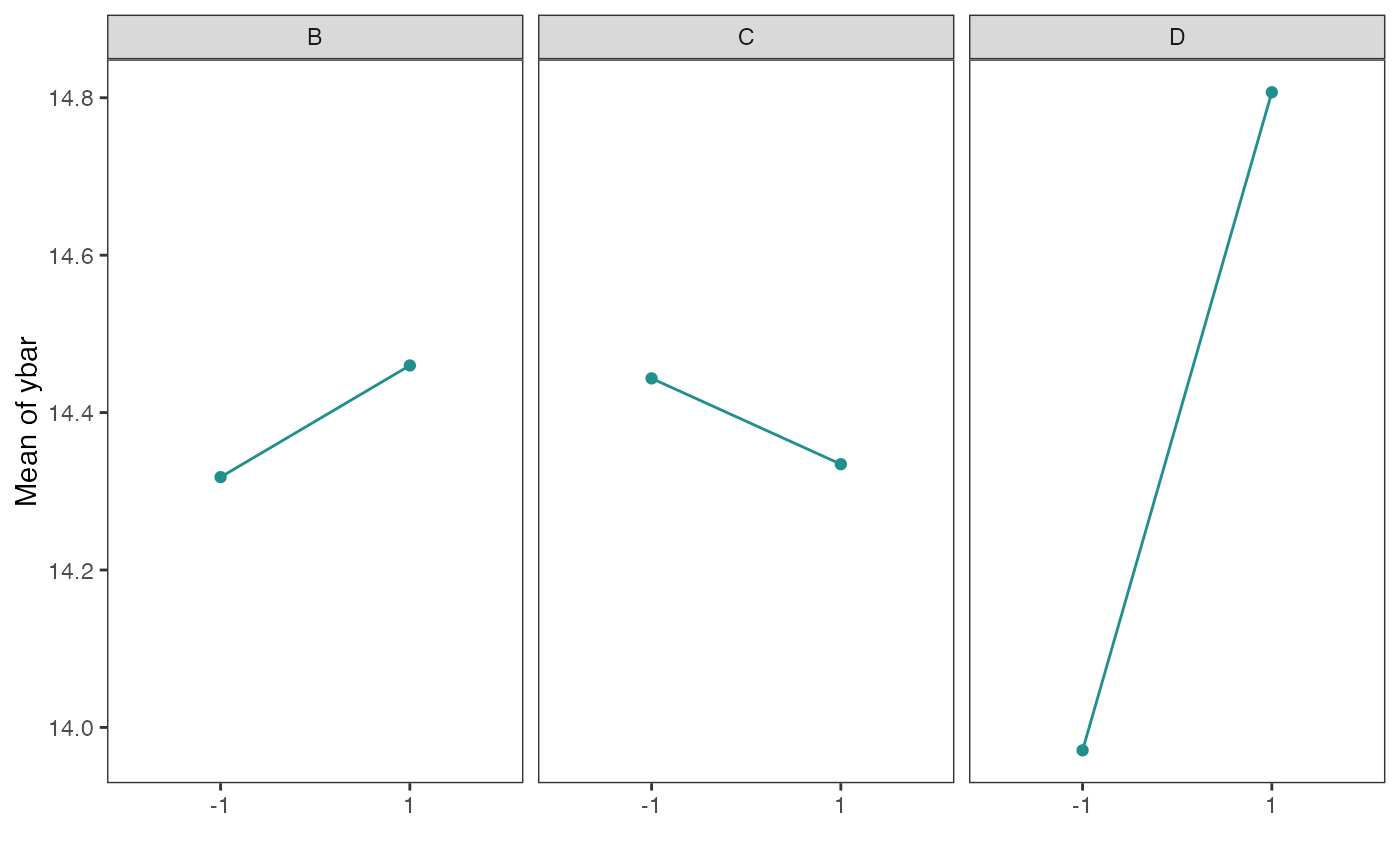
Obtain main effect plots in a factorial design
Usage
main_effects(
  design,
  response,
  exclude_vars = c(),
  n_columns = 2,
  color_palette = NA,
  showplot = TRUE,
  ...
)
Arguments
- design
Design of experiment (Factorial Design)
- response
A character string indicating the response of the data
- exclude_vars
A vector containing variables to exclude
- n_columns
number of columns for facet grid. Default is 2
- color_palette
A character string indicating the color map option to use. Eight options are available: "viridis","cividis","magma","inferno","plasma","rocket","mako","turbo"
- showplot
logical indicating to show the main effect plots. If false, a list of data.frames is returned used to obtain the main effects for each factor. Default is TRUE
- ...
additional parameters to be given to viridisPalette, such as alpha and direction