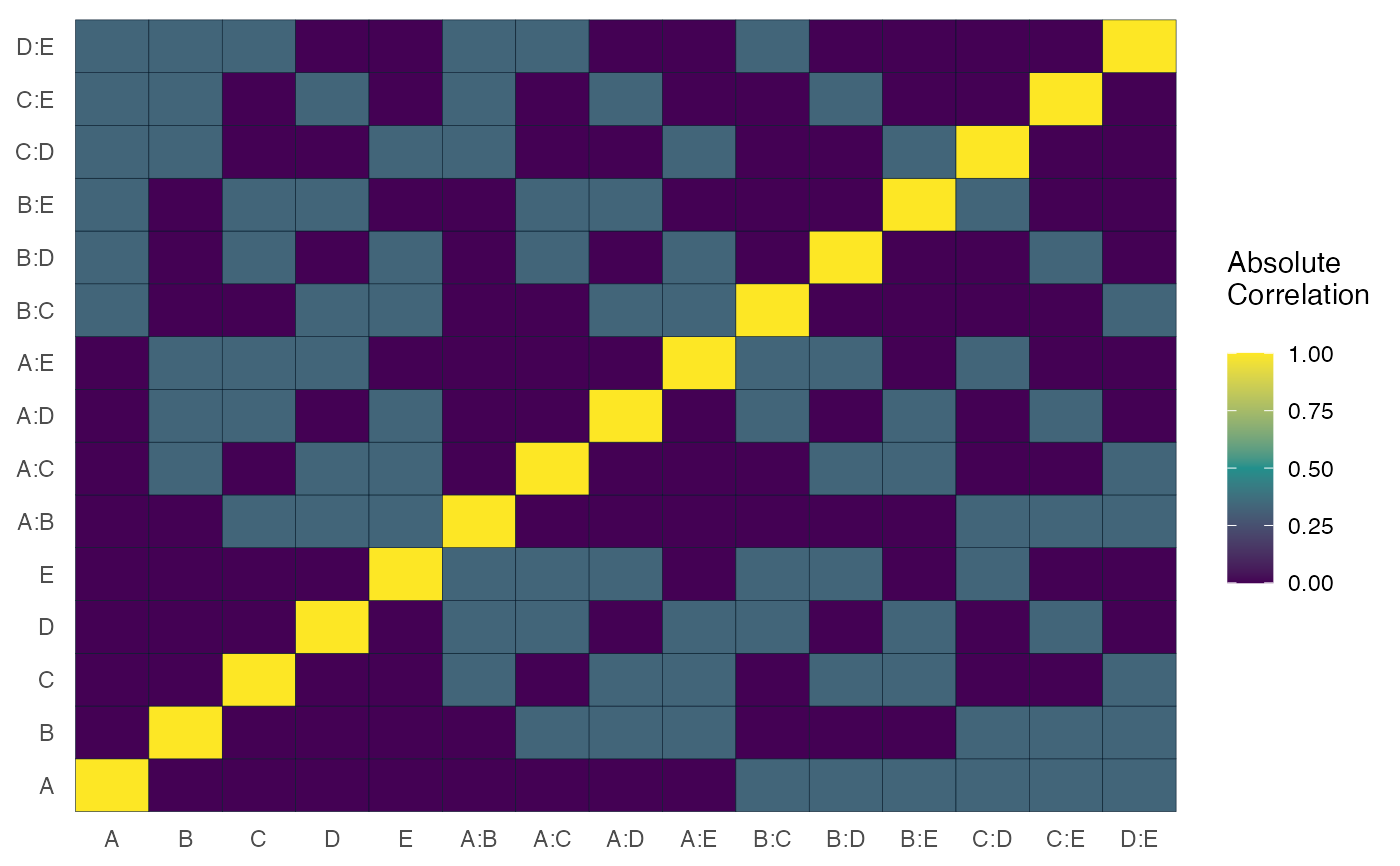
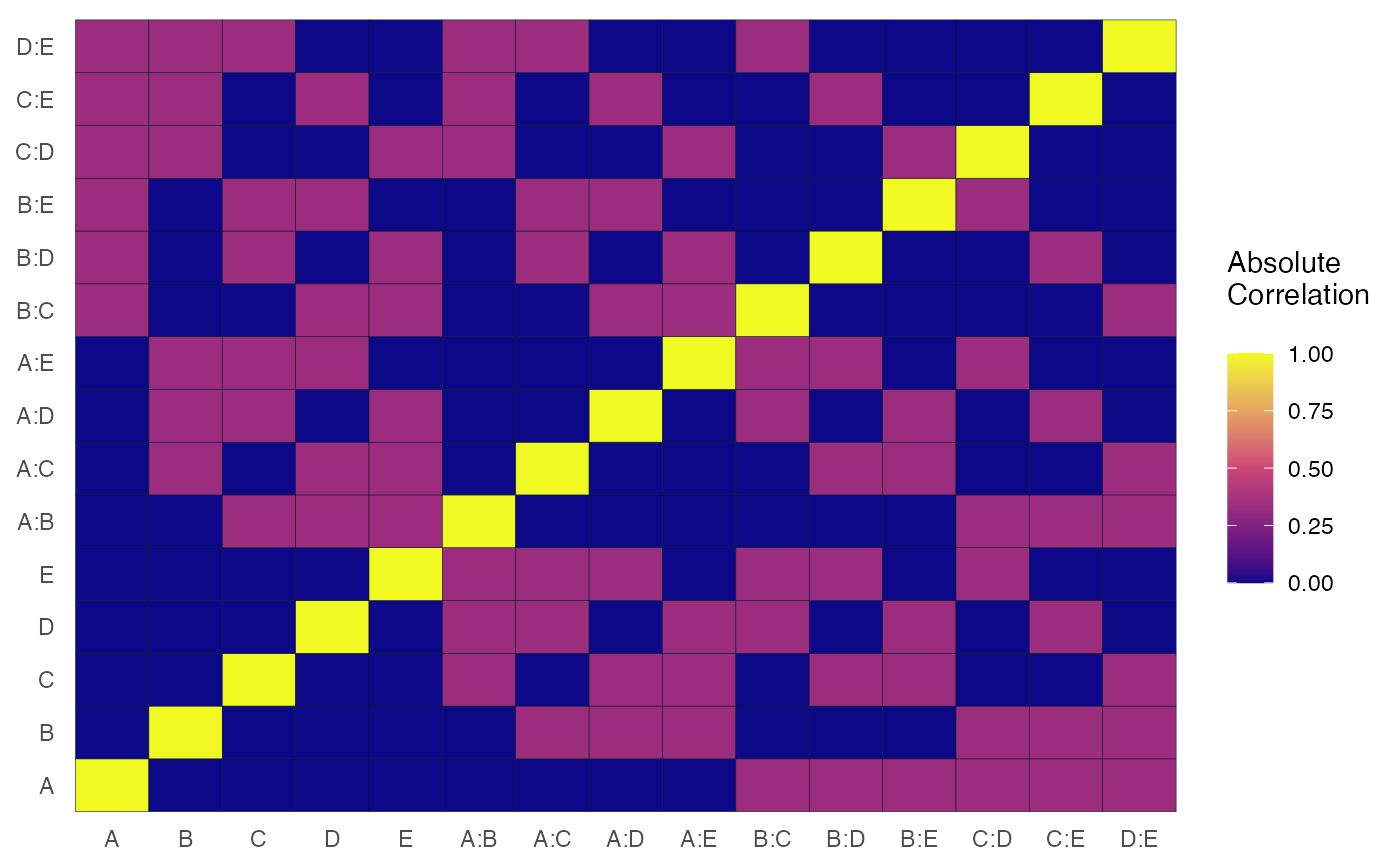
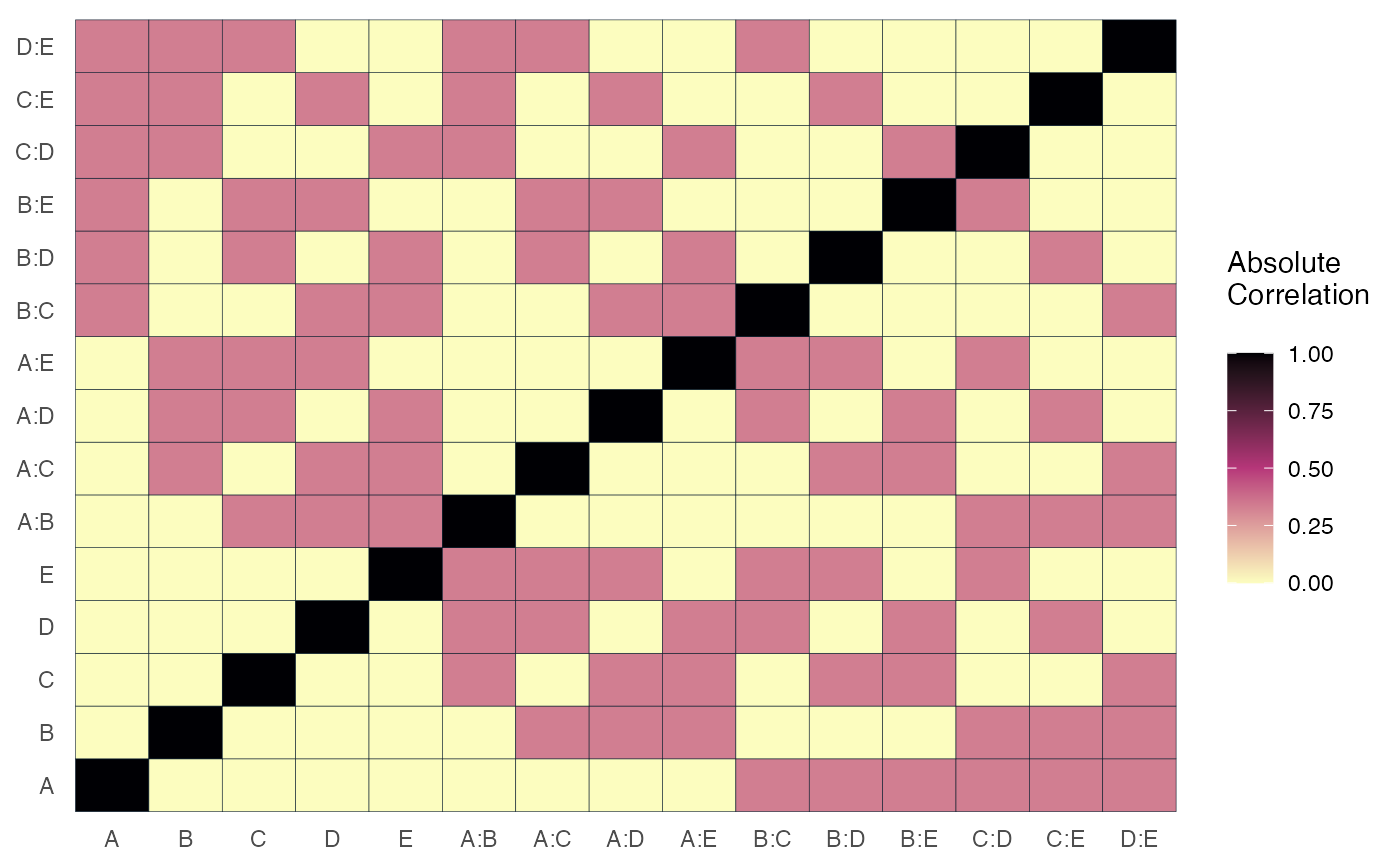
Color Map on Correlations
Usage
alias_matrix(
  design,
  midpoint = 0.5,
  digits = 3,
  color_palette = "viridis",
  showplot = TRUE,
  ...
)
Arguments
- design
Design of experiment (Without response)
- midpoint
A midpoint value between (0,1) to split the color scheme of three colors
- digits
number of digits to round correlation values. Default is 3
- color_palette
A character string indicating the color map option to use. Eight options are available: "viridis","cividis","magma","inferno","plasma","rocket","mako","turbo"
- showplot
logical indicating to show the correlation plot. If false, the correlation/alias matrix is returned. Default is TRUE
- ...
additional parameters to be given to viridisPalette, such as alpha and direction